Public Transport Reliability
Background
Reliability of public transport systems has been considered critically important by most public transport users because passengers are adversely affected by the consequences associated with unreliability, like additional waiting time, late or early arrival at destinations and missed connections, which increases their anxiety and discomfort. Reliability has also been identified as important in determining the mode choice. Therefore, it may be stated that unreliability in public transport drives away existing and prospective passengers. In order to understand the dynamics of the various factors affecting reliability and the degree of impact, it would be worthwhile to model reliability.

A long queue waiting buses.
Measures of public transport reliability
The term reliability can be defined as an attribute of any system that consistently produces the same result (www.dictionary.com). Along similar lines, a previous study defines bus service reliability as “the ability of the service to provide consistent service over a period of time”. A more comprehensive definition has been given as covering all aspects of the service: safety, punctuality, regularity, cleanliness, passenger comfort, documents, security. In the United Kingdom, railway reliability is traditionally measured as a percentage of journeys running on time; whilst in the bus industry reliability have been measured as lost mileage or punctuality in departure time.
There are four broad definitions of bus reliability measures:
- Travel time variability: changes in average travel time for bus routes within a time interval and at a specific level of service, or probability that a trip can be completed within a given time;
- Headway variability: maintaining the scheduled headways;
- Passenger wait time variability: probability of passenger wait time less than a given threshold; or excess wait time: extra time that passengers have to wait because of delayed services;
- Service regularity and punctuality: maintaining the timetable departure or arrival times at timing points all along the route.

A screen at bus stop to display the arriving time.
Aims of measuring reliability
Reliability affects the amount of time passengers must wait at a transit stop for a transit vehicle to arrive, as well as the consistency of a passenger’s arrival time at a destination from day to day. Reliability encompasses both on-time performance, as well as the regularity of headways between successive transit vehicles. The aims of this study are:
- To understand the concept of reliability in public transport and identify measures from viewpoints of bus operators and passengers
- To select measures for evaluation of reliability
- To understand causes and occurrence of unreliability by taking up a public transport route as a case
- To develop public transport model for the test route in DRACULA and explain how select factors affect reliability
Simulation of public transport network
The city of York is located towards the north of England and is a major tourist attraction with a population of around 177,000 (1998). The bus services being offered to the city by the First Group Company (FGC) are of three types: frequent services: which have one bus at least every twelve minutes; standard services: having a bus every 15 to 45 minutes; and less frequent services: which have one bus per hour or less.

A screenshot of the DRACULA model of the south-west region of the City of York. The colours illustrate the congestion levels on the roads, with red being more congested while blue less/no congestion.
Service 4 (Turquoise Line) runs from the University to Acomb The Green via the York Railway Station. The route links up residential areas to the railway station and the university. The service has a frequency of eight minutes during the morning peak hour. The entire route from The University to the Acomb The Green has a scheduled journey time of 41 minutes and has 35 bus stops. Due to survey time constraints, it was decided to cover a shorter section of the route having a travel time of 10 to 15 minutes and having significant passenger traffic for the detailed study. The information on number of passengers boarding and alighting along the route was collected through a reconnaissance survey. As the morning peak period was being modelled, the route was selected in the predominant traffic direction, which is towards the city centre. A route section from Eason View to the York Railway Station, which is around 3.2km long and consists of ten bus stops, was selected for detailed analysis.
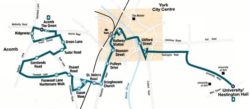
The route map of Service 4.
Fourteen different scenarios, beyond the base-case scenario, and five simulation runs for each scenario were analysed in this research for a stretch of route for Service 4. The scenarios were:
- Base-case: the regular service without any change
- Passenger demand increase: 10%, 15% and 20%
- Congestion increase in general traffic: 1%, 2.5%, 5% and 10%
- Boarding time change
- Bus lane
- Bus stop type
- Fast boarding: 5%, 25%, 50% and 75%
Video of Dracula model.
Results of study
● Extension of bus-lane itself does not improve reliability, but combined with signal gating strategy will bring benefit.
● Unreliability increases with congestion and passenger demand.
● Passenger demand has more serious impact on headway variability than on total journey time.
● Headway variation and number of passengers boarding interrelated.
● Reduced boarding time (advanced ticketing system) brings in most significant improvements.